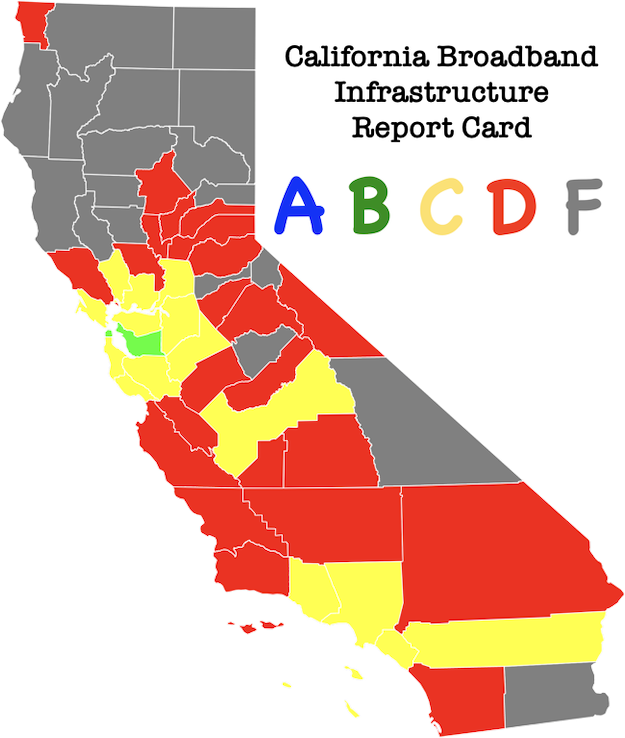
The worst broadband infrastructure in California is, not surprisingly, found in mountain counties at the north end of the state. Trinity and Siskiyou counties both get “F” grades for broadband infrastructure, with a numerical score of dead zero. Sierra County likewise gets an “F”, with a numerical score of 0.03 that’s effectively zero. It is also the county with the highest percentage of population – 88% – without any access to wireline broadband service. It’s a serious problem for rural residents as business, education, health care and education move almost exclusively online during the covid–19 lockdown.
As the map above and the tables below show, the best broadband infrastructure in California can be found in San Francisco and Alameda County, and in Los Angeles and Orange counties, and it generally gets worse the farther you get from those two hubs.
The Worst
| County | Broadband Report Card Grade | GPA | Percent of Population at Zero service |
|---|---|---|---|
| Trinity | F | 0.00 | 83% |
| Siskiyou | F | 0.00 | 17% |
| Humboldt | F | 0.01 | 15% |
| Mariposa | F | 0.01 | 24% |
| Modoc | F | 0.01 | 50% |
| Lassen | F | 0.02 | 56% |
| Sierra | F | 0.03 | 88% |
| Alpine | F | 0.04 | 83% |
| Plumas | F | 0.13 | 35% |
| Inyo | F | 0.17 | 16% |
The Best
| County | Broadband Report Card Grade | GPA | Percent of Population at Zero service |
|---|---|---|---|
| Alameda | B- | 2.77 | 3% |
| San Francisco | B- | 2.73 | 1% |
| San Mateo | C+ | 2.63 | 1% |
| Contra Costa | C+ | 2.40 | 1% |
| Sacramento | C+ | 2.30 | 2% |
| Santa Clara | C+ | 2.27 | 3% |
| Los Angeles | C | 2.09 | 1% |
| Orange | C | 1.97 | 3% |
| San Joaquin | C- | 1.89 | 5% |
| Stanislaus | C- | 1.88 | 4% |
The grades are based on a methodology I first developed in 2013 for the East Bay Broadband Consortium, and have since been updating on a statewide basis for the Central Coast Broadband Consortium and other such regional organisations. It uses the broadband speed and technology claims that Internet service providers submit to the California Public Utilities Commission and Federal Communications Commission every year – the most recent data set is current as of 31 December 2018. The underlying data are not very accurate, but it is precise in the sense that companies tend to be consistent about the way they exaggerate coverage. That makes it useful for comparative purposes, which is what the California Broadband Infrastructure Report Card is all about.
The best broadband infrastructure in California is found in the Bay Area and Sacramento, and the Los Angeles/Orange County core. Those two counties straddle California’s “C” average. The large share of the state’s population those counties represent means what’s available to people there is going to look a lot like what’s available to the average Californian.
San Joaquin and Stanislaus counties also made the top 10 due to upgrades by AT&T, which claims to have built fiber to the premise systems in about 16% of the census blocks (but not necessarily throughout whole census blocks) in those two counties, and Vast Network’s middle mile fiber infrastructure, which runs through a lot of census blocks but isn’t available to homes or most businesses. It’s similar story in Fresno County. The grades reflect infrastructure deployments rather than service availability, so for a lot of Central Valley communities it’s water, water everywhere but not a drop to drink.
California Broadband Infrastructure Report Card, 24 March 2020
Central Coast Broadband Consortium wireline broadband availability analysis (22 March 2020 revision), per 31 December 2018 data
Central Coast Broadband Consortium Broadband Infrastructure Grading Methodology, 20 March 2020
Achieving Ubiquitous Broadband Coverage in the Monterey Bay Region, Monterey Bay Economic Partnership, November 2018

